 Star on GitHub
Chrome Web Developer Tools: Record Requests for Replayable Tests
Most API tests fail for one of two reasons: they were written against an idealized request shape (not what your frontend actually sends), or they were recorded into a tool-specific format that is painful to review and replay in CI.
Chrome Web Developer Tools (the Network panel) gives you a pragmatic middle ground: capture real, production-like HTTP traffic as you exercise a workflow, then convert that capture into replayable, Git-reviewed YAML flows.
This article focuses on the developer-grade workflow: record the right requests, cut the noise, convert to YAML, then make the result deterministic with request chaining and CI-friendly assertions.
Treat Chrome DevTools as a capture device (not a debugging UI)
The Network panel is already the source of truth for “what actually happened on the wire”. The trick is to capture with replayability in mind.
A replayable capture has three properties:
- Bounded scope: only the API calls that define the workflow.
- Environment clarity: every request is clearly tied to a base URL and auth model you can reproduce in CI.
- Deterministic inputs: secrets and volatile identifiers are either parameterized or explicitly chained.
If you capture everything that happened in a messy browser session, you get an unreadable HAR, and worse, it can contain secrets.
Record only what you intend to turn into a test
The fastest way to produce stable tests is to decide upfront what the flow boundary is.
Examples of “good” flow boundaries:
- Login (or token mint) → call one protected endpoint → assert invariant fields
- Create resource → capture returned ID or
Locationheader → fetch resource → assert shape - Checkout simulation against staging: add item → submit order → poll status
Examples of “bad” boundaries:
- “Everything that happens when I load the app” (includes analytics, config prefetches, retries, long-polls)
- “A 20 minute session” (includes unrelated navigation, background refresh, and stale cookies)
In practice, you want a short capture that starts with an explicit auth step (or at least an auth-bearing request you can reproduce), then 2 to 10 API calls that define the behavior you care about.
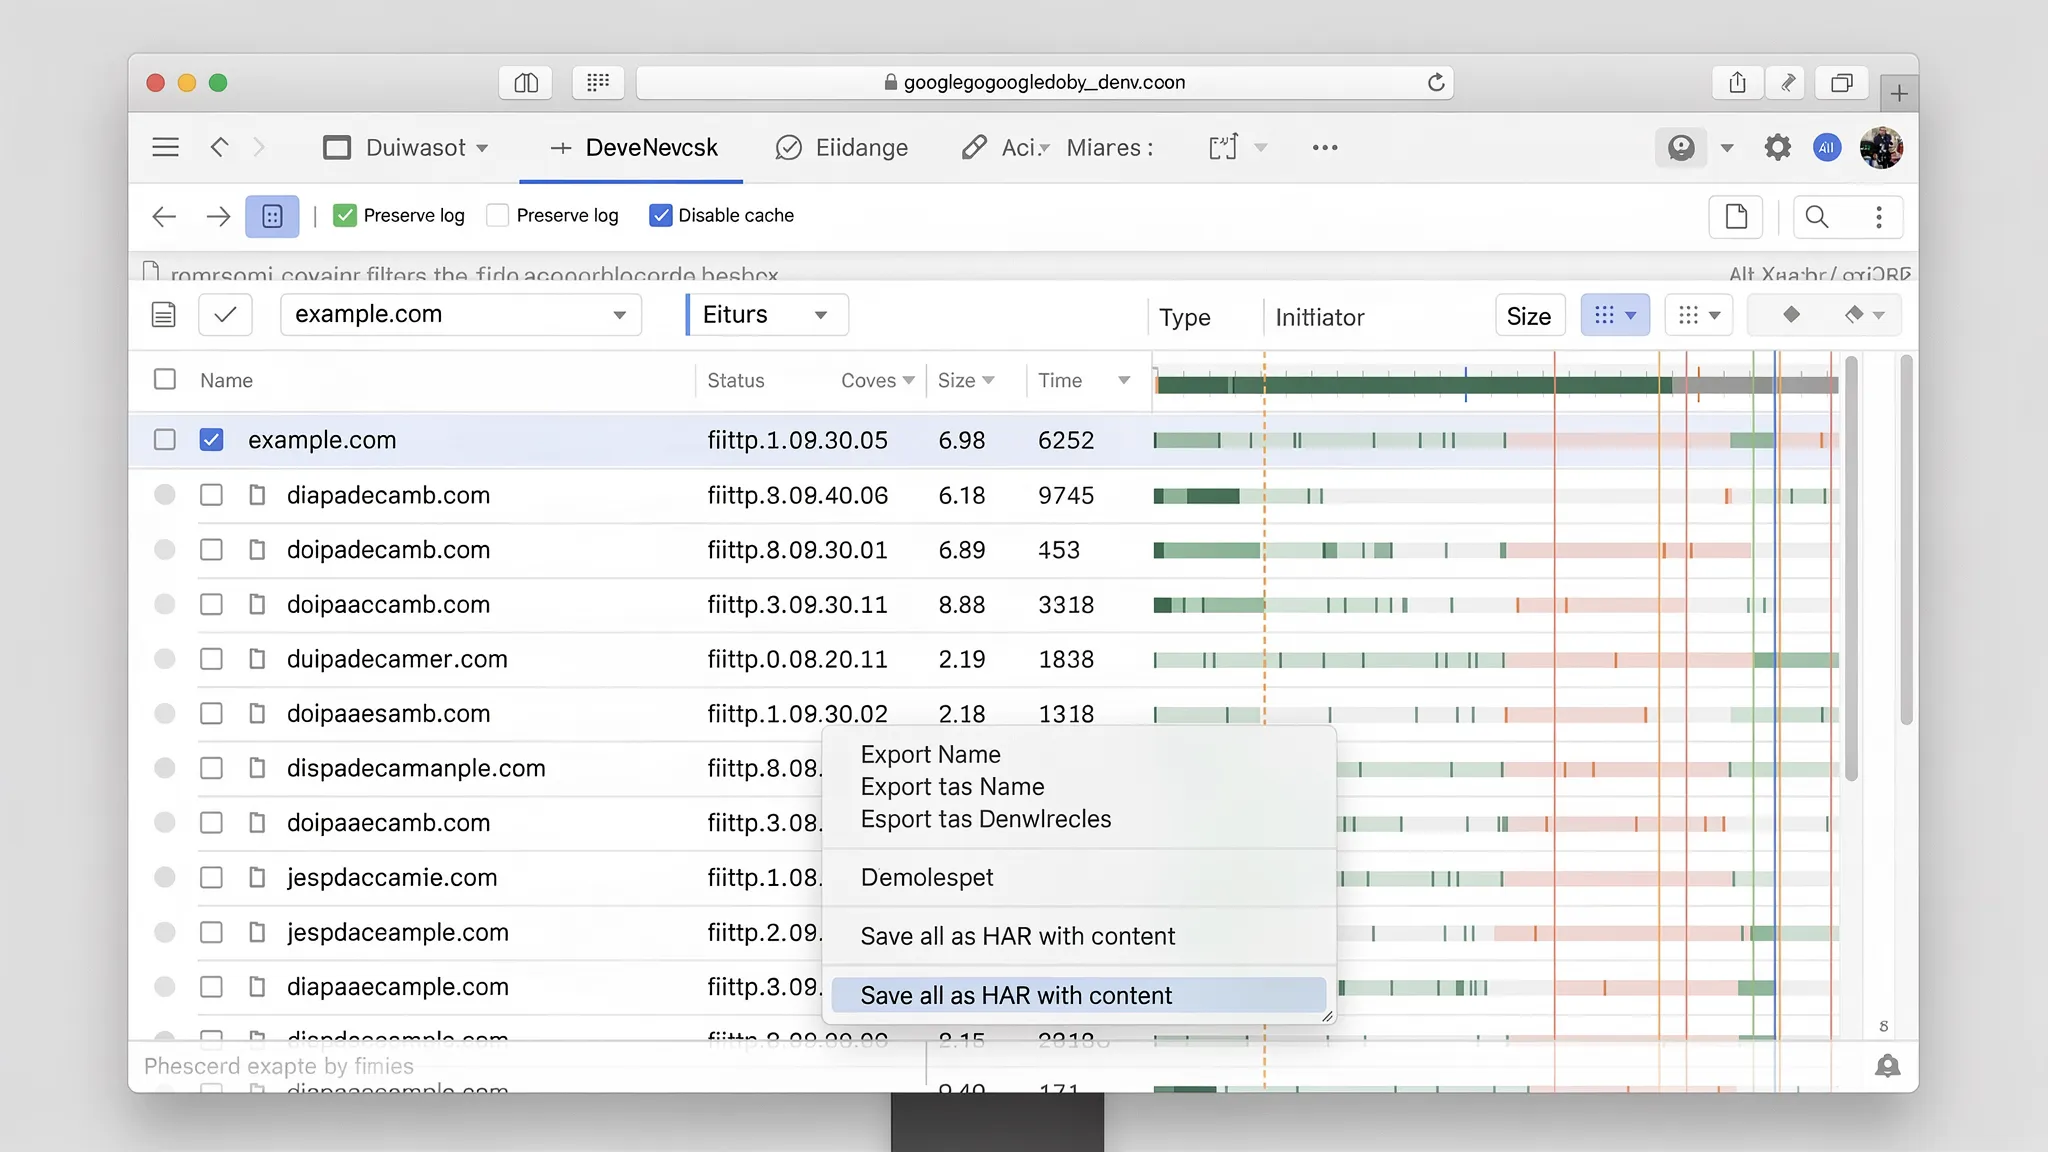
Chrome Web Developer Tools settings that matter for HARs you can replay
You likely know how to open DevTools and the Network panel. What matters here is the capture fidelity and the resulting log shape.
In the Network panel, the settings that usually reduce test flake later are:
- Preserve log: keeps the sequence intact across navigations (useful for multi-page workflows).
- Disable cache (while DevTools is open): avoids “works locally” artifacts caused by cached responses.
- Clear network log right before you begin the workflow: creates a clean start point.
- Filter to your API domain early: reduces third-party noise and makes conversion easier.
Also decide whether you want to include response bodies. For most test generation workflows, exporting “with content” is useful because it allows tooling to infer variable extraction candidates and baseline assertions. The security trade-off is real, so treat HARs as sensitive until redacted.
A note on preflights, redirects, and “hidden” requests
When you convert browser traffic into API tests, you will see things that are irrelevant for server-side replay:
- CORS preflight (OPTIONS) requests: needed for browsers, not for CI runners.
- Redirect hops (especially auth flows): you usually want the final request with the effective headers and body.
- Client hints and browser-only headers: can make server-side replays fail or become brittle.
A good conversion workflow filters these aggressively so your YAML contains the minimal HTTP that matters.
HAR vs “Copy as cURL”: why HAR is usually the right capture for workflow tests
Chrome DevTools lets you “Copy as cURL” for a single request, which is great for debugging. But workflow tests are about sequences, not single calls.
| Capture method | Best for | Weak for | Typical outcome |
|---|---|---|---|
| Copy as cURL | One-off reproduction of a single request | Multi-step flows, chaining, correlated IDs | You hand-stitch scripts and miss dependencies |
| HAR export | End-to-end request sequence with timing and bodies | Noise, sensitive data, browser-only details | Great raw material for YAML flow generation |
| Postman “capture” style workflows | Team exploration in a UI | Reviewability, deterministic diffs, CI portability | Collections drift, scripts accumulate, diffs are noisy |
If your goal is replayable tests stored in Git, HAR is the best raw input, as long as you turn it into a deterministic format quickly and do not treat the HAR itself as the artifact you commit.
(Chrome’s Network panel and export options are documented in the official Chrome DevTools Network features.)
Convert captured requests into replayable YAML flows
Once you have a bounded HAR, the highest leverage step is converting it into human-readable YAML that:
- is reviewable in pull requests
- supports request chaining
- can be executed locally and in CI
DevTools’ core workflow is to take recorded browser traffic (HAR) and convert it into executable YAML flows that you can version in Git. The important part for experienced teams is not “generation”, it is what happens immediately after.
The fastest path to a useful test is:
- Convert HAR → YAML flow.
- Delete irrelevant calls (preflights, third-party, retries, analytics).
- Replace secrets with environment variables.
- Make dependencies explicit via node output references (
{{NodeName.response.body.field}}). - Add JS validation nodes that check invariants, not volatile presentation.
If you want the exact mechanics of exporting a HAR safely, DevTools already maintains a dedicated guide: Generate a HAR file in Chrome (Safely).
Make recorded traffic deterministic (the part most teams skip)
Recorded browser traffic tends to include volatility that looks harmless but will cause CI flake:
- dynamic tokens and CSRF values
- timestamps, request IDs, trace headers
- randomized client IDs and A/B experiment cookies
- unstable ordering in arrays (when you snapshot instead of asserting invariants)
The fix is not “retry more”. The fix is to turn implicit state into explicit YAML state.
Pattern 1: Login (or token mint) → reference → reuse
When a browser is already logged in, your first captured request might include a bearer token that will be invalid in CI. Instead, include the auth step in your flow and reference its output directly in subsequent requests.
Illustrative YAML using the DevTools flow format:
workspace_name: LoginAndFetchProfile

env:
  BASE_URL: '{{BASE_URL}}'
  E2E_USERNAME: '{{E2E_USERNAME}}'
  E2E_PASSWORD: '{{E2E_PASSWORD}}'

flows:
  - name: LoginAndFetchProfile
    steps:
      - request:
          name: Login
          method: POST
          url: '{{BASE_URL}}/auth/login'
          headers:
            Content-Type: application/json
          body:
            username: '{{E2E_USERNAME}}'
            password: '{{E2E_PASSWORD}}'

      - js:
          name: ValidateLogin
          code: |
            export default function(ctx) {
              if (ctx.Login?.response?.status !== 200) throw new Error("Login failed");
              if (!ctx.Login?.response?.body?.access_token) throw new Error("No token");
              return { validated: true };
            }
          depends_on: Login

      - request:
          name: GetProfile
          method: GET
          url: '{{BASE_URL}}/me'
          headers:
            Authorization: 'Bearer {{Login.response.body.access_token}}'
          depends_on: Login

      - js:
          name: ValidateProfile
          code: |
            export default function(ctx) {
              if (ctx.GetProfile?.response?.status !== 200) throw new Error("Expected 200");
              if (typeof ctx.GetProfile?.response?.body?.id !== 'string') throw new Error("id not string");
              if (!/@/.test(ctx.GetProfile?.response?.body?.email)) throw new Error("email missing @");
              return { validated: true };
            }
          depends_on: GetProfile
What matters:
- The token is produced inside the flow and referenced directly via
{{Login.response.body.access_token}}. - The dependency is visible in Git diffs.
- JS validation nodes check invariants (shape/type), not volatile values.
If you need deeper assertion patterns, DevTools has a dedicated guide with examples: JSON Assertion Patterns for API Tests.
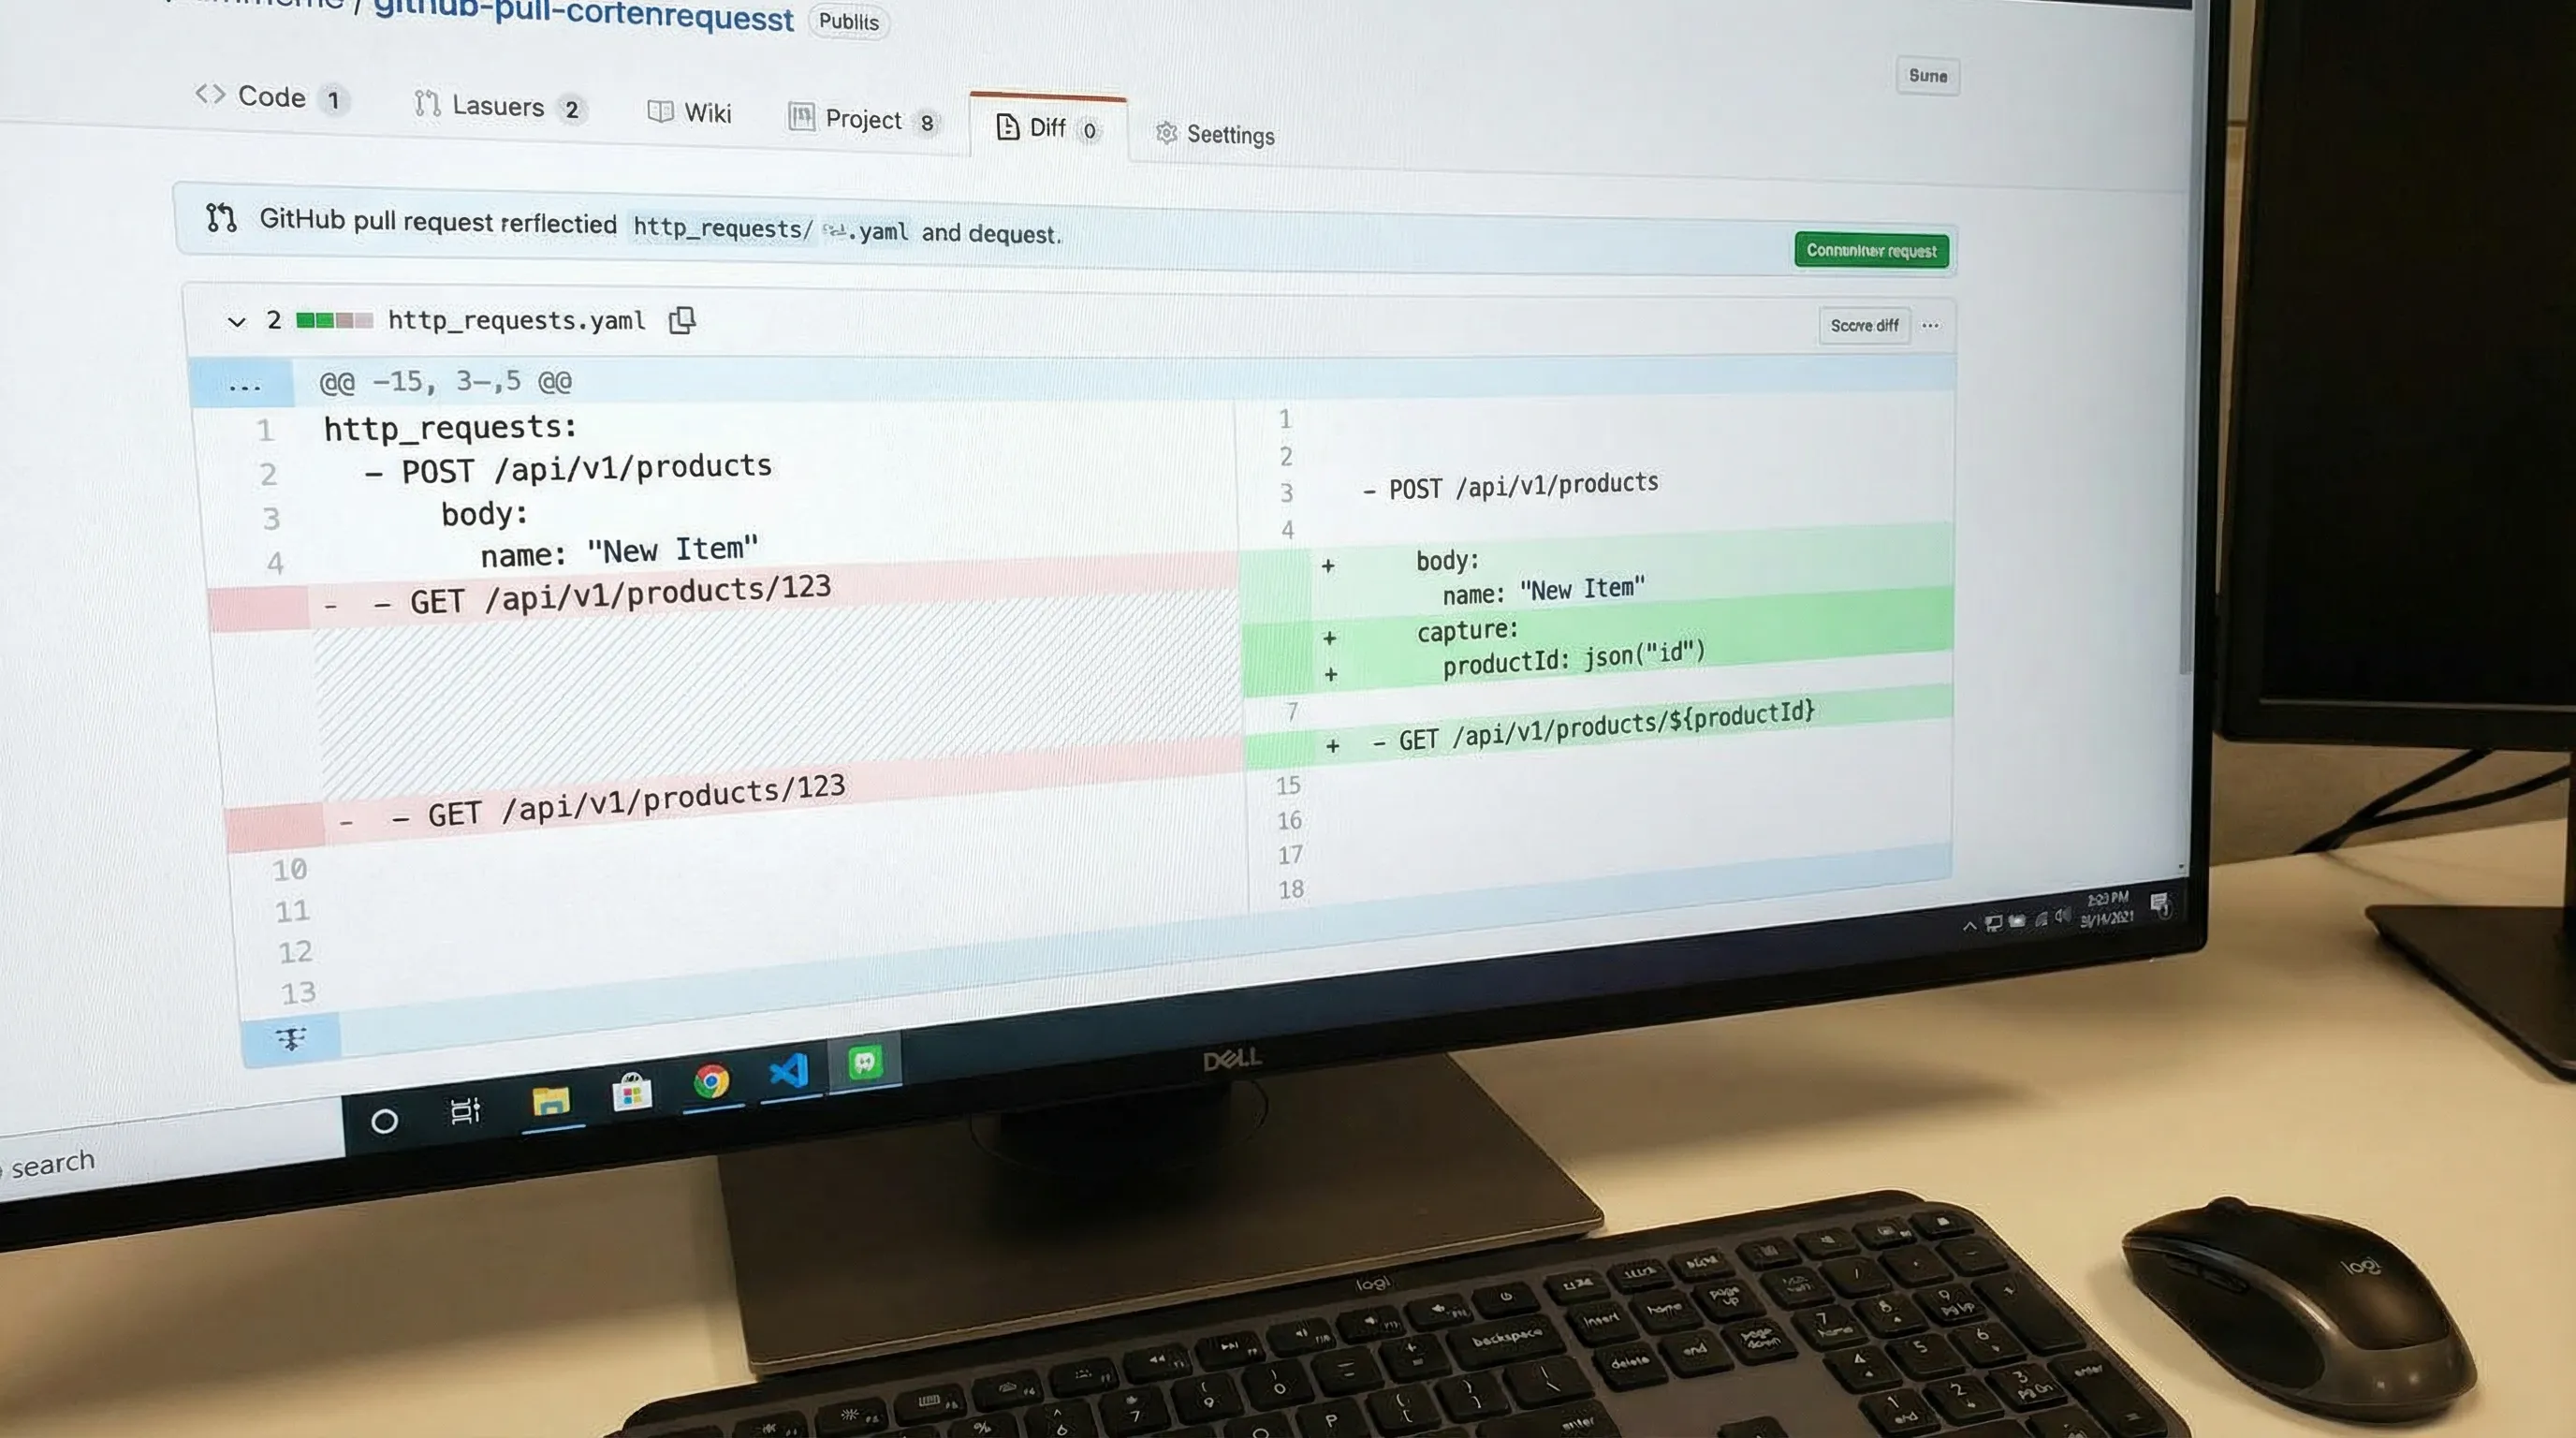
Pattern 2: Create → reference ID → fetch
Browser traffic often encodes IDs deep in JSON responses, or relies on follow-up calls that embed the ID in the URL. Make that explicit by referencing the response body directly.
steps:
  - request:
      name: CreateWidget
      method: POST
      url: '{{BASE_URL}}/widgets'
      headers:
        Content-Type: application/json
      body:
        name: 'ci-{{RUN_ID}}'

  - js:
      name: ValidateCreate
      code: |
        export default function(ctx) {
          if (ctx.CreateWidget?.response?.status !== 201) throw new Error("Expected 201");
          if (!ctx.CreateWidget?.response?.body?.id) throw new Error("Missing id");
          return { validated: true };
        }
      depends_on: CreateWidget

  - request:
      name: GetWidget
      method: GET
      url: '{{BASE_URL}}/widgets/{{CreateWidget.response.body.id}}'
      depends_on: CreateWidget

  - js:
      name: ValidateGet
      code: |
        export default function(ctx) {
          if (ctx.GetWidget?.response?.status !== 200) throw new Error("Expected 200");
          if (ctx.GetWidget?.response?.body?.id !== ctx.CreateWidget?.response?.body?.id) {
            throw new Error("ID mismatch");
          }
          return { validated: true };
        }
      depends_on: GetWidget
The response body of CreateWidget is referenced directly via {{CreateWidget.response.body.id}} in the next request URL, making the dependency explicit without a separate capture step.
Pattern 3: Stop carrying browser-only headers into CI
A common failure mode when replaying browser traffic server-side is “why does this request fail when I replay it exactly?” The answer is usually that you are replaying headers that only make sense in a browser context.
Examples that often do not belong in CI API tests:
sec-fetch-*,sec-ch-ua*,priorityoriginandreferer(unless your API explicitly enforces them)- huge
cookieblobs (prefer explicit auth) - tracing headers that are generated per request (
x-request-id,traceparent)
The deterministic approach is to keep only headers that the server contract requires.
Store the YAML, not the HAR
HAR files are great transient inputs and terrible long-term test definitions:
- they frequently contain secrets (cookies, tokens, response bodies)
- they capture a lot of noise and incidental state
- they are hard to review meaningfully in PRs
The workflow that scales is:
- HAR is an input artifact (kept local, or stored temporarily with redaction policies).
- YAML is the definition of record (committed, reviewed, and executed).
If your team needs explicit guidance on HAR redaction, DevTools has a thorough write-up: How to Redact HAR Files Safely.
Make PR review work: YAML conventions that keep diffs stable
Replayable tests live or die by reviewability. If every re-generation creates a giant diff, engineers stop trusting the tests.
Practical conventions that help:
- Stable step names (treat them as public API for your flow)
- Deterministic key ordering and formatting
- Node output references placed near the steps that produce and consume them
- Minimal, sorted headers and query params
DevTools covers Git-friendly formatting conventions in depth here: YAML API Test File Structure: Conventions for Readable Git Diffs.
Run the same flow locally and in CI
A capture is only useful if the replay is cheap and repeatable.
The CI pattern that tends to work well is:
- Keep flows in
flows/(or similar) - Keep environment templates in
env/ - Inject secrets via CI secret stores (never commit them)
- Emit JUnit so failures show up as first-class CI test results
If you are using GitHub Actions, DevTools already provides a copy-paste workflow and repo layout guidance: API regression testing in GitHub Actions.
For teams coming from Newman, there is also a practical mapping of CI expectations (exit codes, reports, CLI execution): Newman alternative for CI: DevTools CLI.
How this differs from Postman, Newman, and Bruno in practice
This is not about “which UI feels nicer”. It is about what survives contact with Git and CI.
Postman + Newman
- Definition format: Postman collection JSON + environments.
- Common failure mode: logic drifts into scripts, collections become hard to review, diffs are noisy, CI runs are coupled to export steps.
- Chaining: powerful, but often implemented via JavaScript snippets that are difficult to standardize and code review.
Bruno
- Definition format:
.brufiles (a custom DSL). - Common failure mode: better Git ergonomics than Postman, but still a tool-specific format that your pipelines and reviewers must learn.
DevTools (YAML-first)
- Definition format: native YAML flows you can review like code.
- Key workflow difference: use Chrome DevTools captures as raw input, then normalize into YAML that is portable across local runs and CI.
If your organization’s constraint is “tests must be readable, diffable, and enforceable via PR checks”, YAML-first is usually the most direct route.
Common pitfalls when turning Chrome captures into tests
You recorded a logged-in session, but not the auth mechanism
Fix: re-record starting from token mint or login, then chain everything using node output references.
Your capture depends on local browser state
Examples: cookies from other tabs, cached config, service worker behavior.
Fix: capture in a clean context (often Incognito), disable cache, and keep the flow short.
Your capture includes concurrency and retries
Browsers will retry, prefetch, and parallelize. If you convert that literally, you create ordering assumptions.
Fix: keep only the linear requests that define the workflow, and explicitly model any required polling or retry behavior in the flow runner semantics (not by trusting incidental browser timing).
Your assertions are snapshots of unstable payloads
Fix: assert invariants, normalize volatile fields, and avoid brittle “exact match” snapshots unless you have a normalization story.
A useful reference on flake sources and deterministic fixes is: Deterministic API Assertions: Stop Flaky JSON Tests in CI.
A practical mental model: record, reduce, chain, assert, gate
- Record with Chrome Web Developer Tools (Network) against a controlled environment.
- Reduce to the minimal request sequence.
- Chain explicit state (tokens, IDs, CSRF) via node output references.
- Assert invariants that matter to your API contract using JS validation nodes.
- Gate merges by running the YAML in CI with reports and artifacts.
That pipeline is what turns "I can reproduce it in my browser" into "we can enforce it on every PR, deterministically."
For the full guide to YAML-native API testing, including syntax patterns, variable passing, assertions, and Git workflows, see: YAML-Native API Testing: Define, Version, and Run Tests as Code.